
Right Censoring with survivalMPL
right-censoring.RmdOverview
A survival time is right censored when follow-up ends before
the event occurs: all we know is that the event time exceeds the last
observation time. This is the most common censoring scheme, and the one
survival::coxph() handles through the partial
likelihood.
coxph_mpl() fits the same proportional hazards model,
but estimates the baseline hazard
jointly with
instead of profiling it out. The practical consequence is that a fit
gives absolute hazard and survival estimates directly, with standard
errors, rather than requiring a separate Breslow-type step
afterwards.
Encoding right-censored observations
Right-censored data use the ordinary two-argument response, exactly
as in coxph():
Surv(time, status)where status is 1/TRUE for an
observed event and 0/FALSE for a censored
observation. This is the one scheme that does not need
type = "interval2"; internally coxph_mpl()
converts it to that form anyway.
Example: survival::lung
The lung data from the survival package
records survival in patients with advanced lung cancer.
status is coded 2 for death and 1
for censored, so the event indicator is status == 2.
library(survivalMPL)
#> Loading required package: survival
#> Loading required package: MASS
library(survival)

lung <- na.omit(lung[, c("time", "status", "age", "sex", "ph.karno", "wt.loss")])

c(n = nrow(lung), events = sum(lung$status == 2),
  censored = sum(lung$status == 1))
#>        n   events censored
#>      214      152       62
Model fit
Little beyond the formula and the data is required. The defaults use a uniform (piecewise-constant) baseline hazard, take the number of knots from the number of events, and select the smoothing value automatically by the marginal likelihood method. The one change made here is the convergence tolerance, set to the used throughout Ma et al. (2024); at the default the outer iterations do not settle on this dataset - see Control Parameters:
fit_lung <- coxph_mpl(
  Surv(time, status == 2) ~ age + sex + ph.karno + wt.loss,
  data = lung,
  tol  = 1e-05
)

summary(fit_lung)
#>
#> coxph_mpl(formula = Surv(time, status == 2) ~ age + sex + ph.karno +
#>     wt.loss, data = lung, tol = 1e-05)
#>
#> -----
#>
#> Cox Proportional Hazards Model Fit Using MPL
#>
#>
#> Penalized log-likelihood  :  -1059.173
#> Estimated smoothing value :  5945063
#> Convergence               :  Yes (101 + 571 iter.)
#>
#> Data             : lung
#> Number of obs.   : 214
#> Number of events : 152 (71.02804%)
#> Number of cens.  :  62 (28.97196%)
#>
#> Regression parameters : Surv(time, status == 2) ~ age + sex + ph.karno + wt.loss
#>            Estimate Std. Error z-value Pr(>|z|)
#> age       0.0144154  0.0101531  1.4198 0.155666
#> sex      -0.5103399  0.1708342 -2.9873 0.002814 **
#> ph.karno -0.0117159  0.0089906 -1.3031 0.192529
#> wt.loss  -0.0017065  0.0071640 -0.2382 0.811722
#> ---
#> Signif. codes:  0 '***' 0.001 '**' 0.01 '*' 0.05 '.' 0.1 ' ' 1
#>
#> Baseline hasard parameters approximated using Uniform :
#>  (11 equal events bins)
#>           1           2           3           4           5           6
#> 0.003163491 0.003488916 0.004576128 0.005400816 0.005924636 0.006389894
#>           7           8           9          10          11
#> 0.006875642 0.007437590 0.007988655 0.008295504 0.008327673
#>
#> -----
The coefficient table is read as in any Cox fit: sex is
strongly protective (coded 1 = male, 2 = female), and higher
ph.karno (better performance status) is associated with
lower hazard. The summary also reports the estimated baseline hazard
coefficients
,
which have no counterpart in a partial likelihood fit.
Every one of those defaults can be overridden through
coxph_mpl.control() - the basis, the knots, the smoothing
parameter, the iteration limits. The Control Parameters
article covers them one at a time.
Baseline hazard and survival
Because
is part of the model, it can be plotted with confidence bands straight
from the fitted object. plot() produces four panels: the
basis functions, then the estimated baseline hazard, cumulative hazard
and survival.
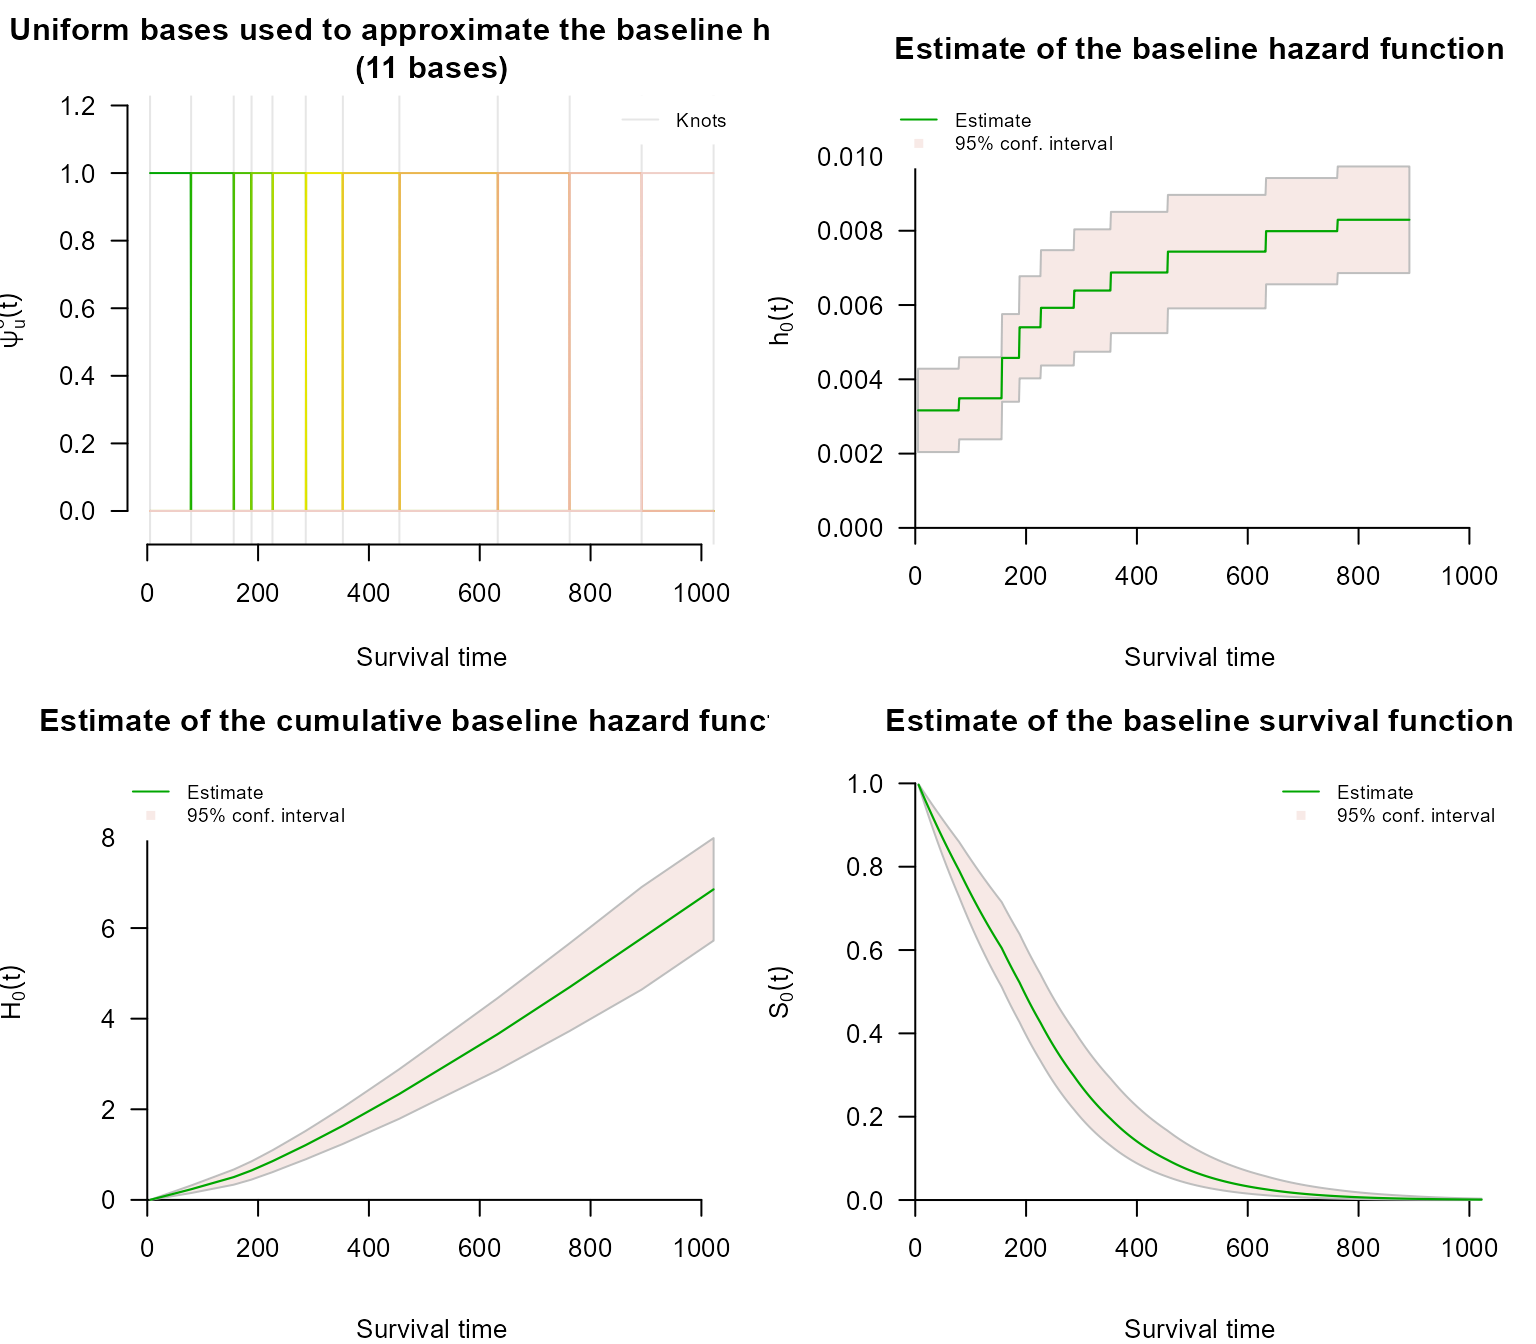
In the first panel each of the
basis functions is drawn in its own colour, running through
terrain.colors() from the earliest to the latest, so the
colour simply indexes
in
and carries no other meaning. With the default uniform basis each
is an indicator on one knot interval, so the panel reads as a row of
adjacent boxes of height 1, one colour per interval; the pale grey
verticals are the knots
.
A basis drawn dashed would indicate
driven to zero, meaning that interval contributes nothing to the fitted
hazard.
The second panel is the estimated baseline hazard itself: a step function whose height on knot interval is . It is the one quantity a partial likelihood fit cannot give you, so it is worth drawing on its own:
plot(fit_lung, which = 2, ask = FALSE, cex.main = 0.9)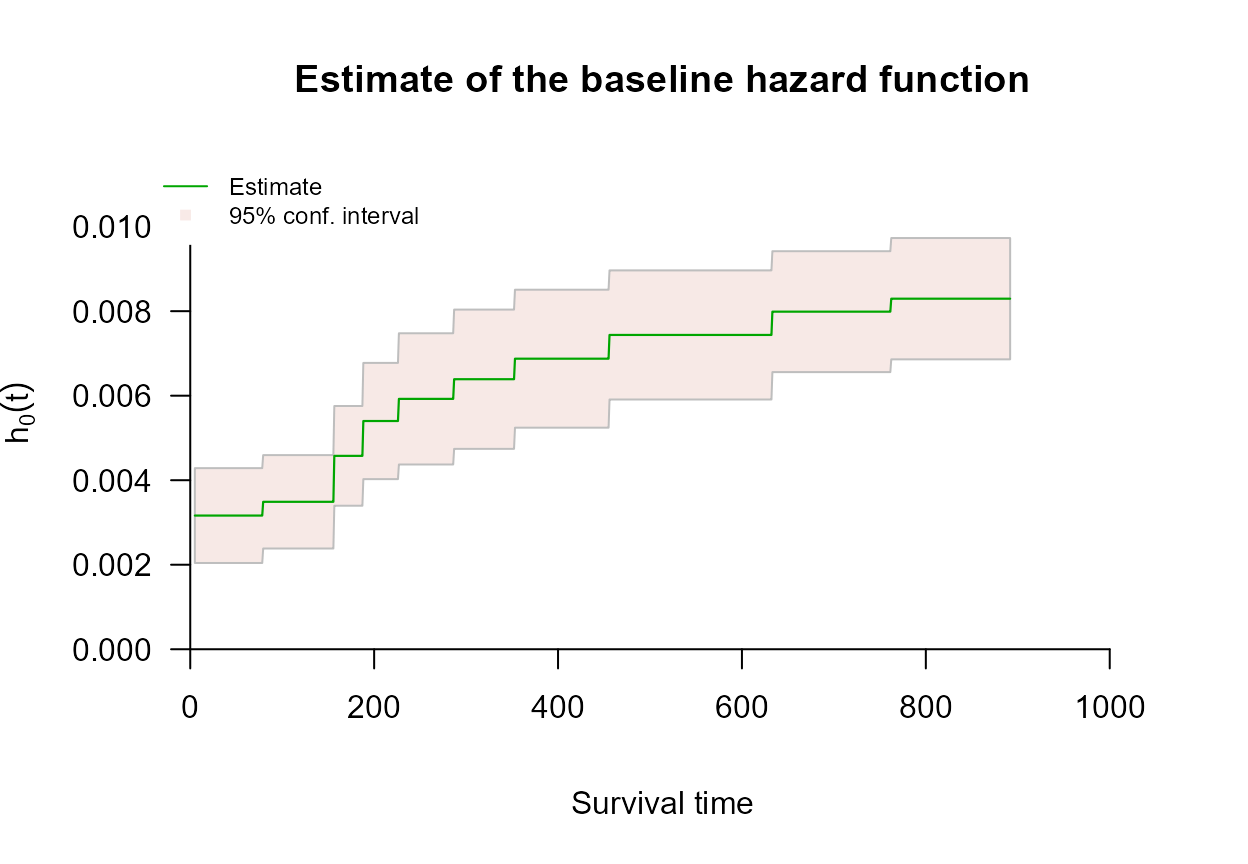
The hazard climbs steadily across follow-up - more than doubling between the first knot interval and the last - and flattens only in the final intervals, where few patients remain at risk and the confidence band widens accordingly.
Predicted survival
predict() returns absolute estimates with standard
errors and pointwise confidence limits. With no i argument
it evaluates at the mean covariate vector:
pred_lung <- predict(fit_lung, type = "survival")
head(pred_lung)
#>        time  survival           se       low      high
#> 1  4.999000 1.0000000 0.0000000000 1.0000000 1.0000000
#> 2  6.017019 0.9985435 0.0002149955 0.9981135 0.9989734
#> 3  7.035038 0.9970890 0.0004293647 0.9962303 0.9979478
#> 4  8.053057 0.9956367 0.0006431090 0.9943505 0.9969229
#> 5  9.071076 0.9941865 0.0008562298 0.9924741 0.9958990
#> 6 10.089095 0.9927385 0.0010687283 0.9906010 0.9948759
A single subject is selected with i (one row index at a
time; only the first element is used):
pred_one <- predict(fit_lung, type = "survival", i = 1)
head(pred_one)
#>        time  survival           se       low      high
#> 1  4.999000 1.0000000 0.0000000000 1.0000000 1.0000000
#> 2  6.017019 0.9982519 0.0002579962 0.9977359 0.9987679
#> 3  7.035038 0.9965068 0.0005150903 0.9954766 0.9975370
#> 4  8.053057 0.9947648 0.0007712848 0.9932222 0.9963074
#> 5  9.071076 0.9930258 0.0010265820 0.9909727 0.9950790
#> 6 10.089095 0.9912899 0.0012809843 0.9887279 0.9938519
Residuals
residuals() returns both Cox-Snell and martingale
residuals. For a subject observed exactly, the Cox-Snell residual is the
fitted cumulative hazard that subject accumulated,
with censored observations adjusted so that every residual estimates the same quantity under the model. The martingale residual is then : the difference between the number of events actually observed for subject (0 or 1) and the number the model expects.
res_lung <- residuals(fit_lung)
par(mfrow = c(1, 2), mar = c(4, 4, 3, 1))
plot(res_lung, which = 1:2, ask = FALSE)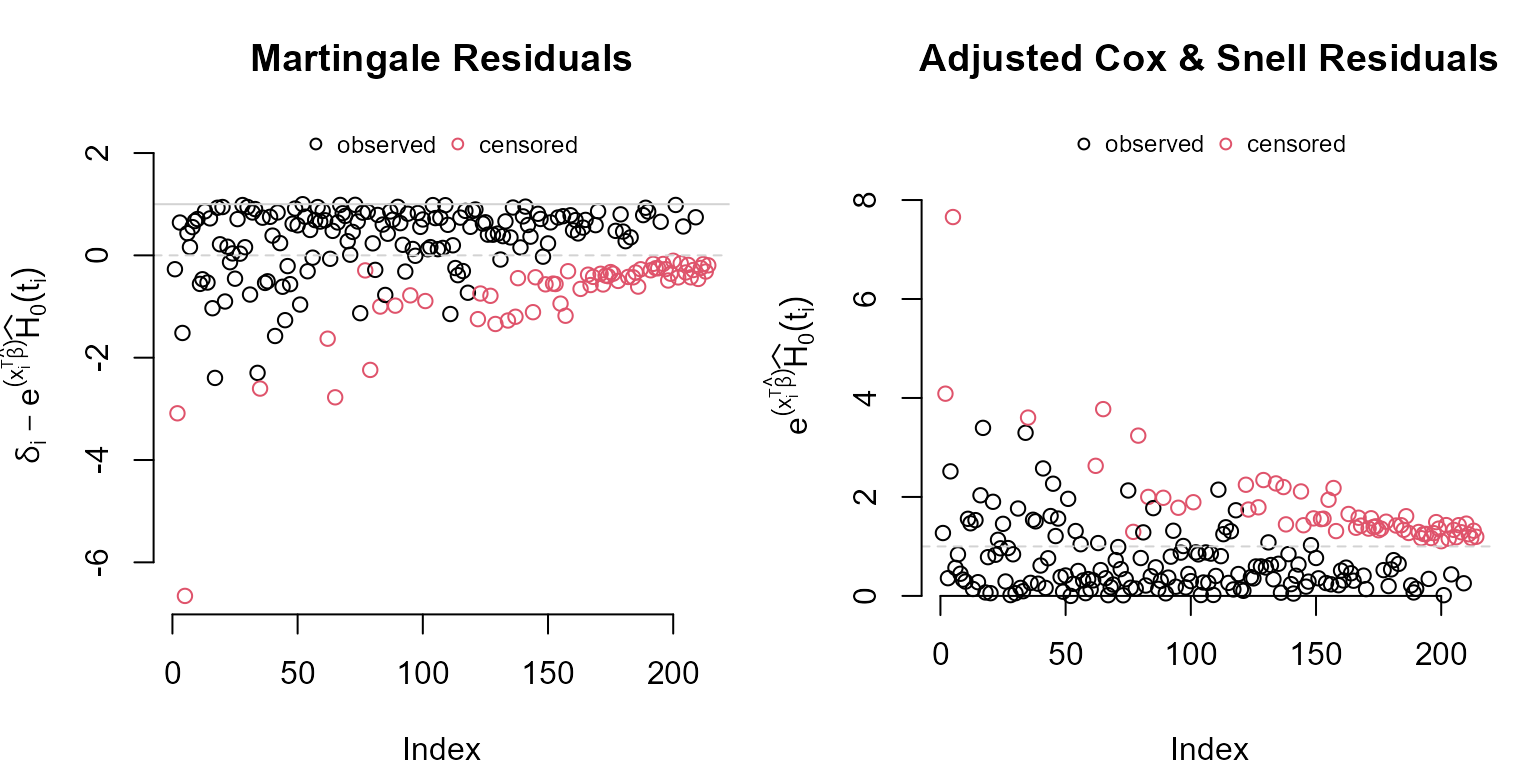
Read them as follows.
- Martingale residuals are bounded above by 1 and unbounded below, so the cloud is asymmetric by construction: censored observations (red) are at or below zero, events (black) are pulled towards 1. A residual close to 1 marks a subject who died far earlier than the model predicted, a large negative one a subject who survived far longer. Here a handful of subjects sit below , one of them near : those are the long survivors the fitted model finds most surprising, and they are worth looking at individually before concluding anything about the model as a whole.
- Cox-Snell residuals behave like a censored sample from a unit exponential distribution when the model is correct, so most sit below 1 with a thinning right tail. A mass of residuals far above 1 indicates the fitted cumulative hazard is wrong, usually through a mis-specified covariate effect rather than a mis-specified baseline.
The horizontal axis of both panels is the row number, which carries
meaning only if the rows arrived in a meaningless order. In
lung they did not: the censored subjects are concentrated
in the later rows (3 of the first 54 are censored, against 36 of the
last 53), which is why the red points drift to the right of both panels.
That is a fact about the data file, not about the fit.
Next steps
-
Control Parameters covers
coxph_mpl.control(): the basis, the knots, the smoothing value , the iteration limits and the convergence tolerance used above. -
Left Truncation covers delayed entry, where
subjects join the risk set only at some entry time. Right-censored data
are often also left truncated, and
coxph_mpl()handles it through theentryargument. -
Interval Censoring covers the other censoring
scheme, which uses the
type = "interval2"response. - Basis Functions for the Baseline Hazard explains the four choices for and how the knots are placed.
-
Comparing
coxph()andcoxph_mpl()fits both to the same right-censored data and contrasts the results.